


SEO & Publishing Details
| SEO Title | A1C vs. Blood Sugar: Understanding the Connection |
| Meta Description | Learn how A1C relates to average blood sugar, how estimated average glucose is calculated, why daily readings differ, and how to interpret both measurements responsibly. |
| Suggested Slug | a1c-vs-blood-sugar-understanding-the-connection |
| Primary Keyword | A1C vs blood sugar |
| Secondary Keywords | A1C to blood sugar, estimated average glucose, eAG, HbA1c, average blood glucose, A1C levels, glucose monitoring |
| Target URL | https://a1ccalculator.us/calculators/a1c-to-blood-sugar |
| Anchor Text | A1C to blood sugar calculator |
| Recommended Length | 1,400+ words |
A1C vs. Blood Sugar: How the Numbers Connect and What They Mean
Blood sugar numbers can be confusing because they are reported in different ways. A glucose meter might show a reading such as 92 mg/dL before breakfast and 168 mg/dL after a meal, while a laboratory report may list an A1C of 6.8%. All of these numbers relate to glucose, but they describe different time frames and answer different questions.
A blood glucose reading is a snapshot of what is happening at a particular moment. A1C, by contrast, reflects average glucose exposure over roughly the previous two to three months. Understanding how these measurements connect can make laboratory reports easier to interpret and can help people have more informed conversations with their healthcare team.
The key is not to treat one number as a replacement for the other. A1C and daily glucose readings are most useful when they are considered together, because each provides information the other cannot show.
What Does an A1C Result Actually Measure?
A1C, also called HbA1c or glycated hemoglobin, measures the percentage of hemoglobin in red blood cells that has glucose attached to it. Hemoglobin is the protein that carries oxygen through the body. As glucose circulates in the bloodstream, some of it naturally binds to hemoglobin.
Because red blood cells remain in circulation for several months, the percentage of glycated hemoglobin provides a longer-term view of glucose exposure. Higher average glucose generally leads to a higher A1C percentage, while lower average glucose generally leads to a lower A1C percentage.
This does not mean that A1C is a simple average of every glucose reading a person has taken. It is a laboratory measurement influenced by glucose exposure over time and by the lifespan of red blood cells. More recent weeks can have a stronger influence on the result than readings from several months earlier.
How Is Blood Sugar Different From A1C?
Blood glucose testing measures the amount of glucose present in the blood at a specific time. In the United States, glucose is commonly reported in milligrams per deciliter, or mg/dL. In many other countries, it is reported in millimoles per liter, or mmol/L.
A finger-stick reading can change rapidly. Food, exercise, medication, stress, illness, sleep, and the timing of the test may all affect the result. A reading taken before a meal can therefore look very different from one taken one or two hours after eating.
A1C changes more slowly because it reflects a much longer period. One unusual meal or one stressful day will not usually determine the result. Instead, repeated glucose patterns across many days and weeks contribute to the percentage that appears on the laboratory report.
How A1C Can Be Converted to Estimated Average Glucose
To make A1C easier to compare with familiar glucose readings, researchers developed a relationship between A1C and estimated average glucose, usually abbreviated as eAG. The American Diabetes Association uses the following relationship: eAG in mg/dL is approximately 28.7 multiplied by A1C, minus 46.7.
The conversion is useful because it expresses a laboratory A1C percentage in the same units many people see on a glucose meter. It is important to remember, however, that eAG is an estimate of long-term average glucose. It is not a prediction of what a meter should display at a particular moment.
| A1C | Estimated Average Glucose (mg/dL) | Estimated Average Glucose (mmol/L) |
| 5.0% | 97 | 5.4 |
| 6.0% | 126 | 7.0 |
| 6.5% | 140 | 7.8 |
| 7.0% | 154 | 8.6 |
| 8.0% | 183 | 10.1 |
| 9.0% | 212 | 11.8 |
| 10.0% | 240 | 13.4 |
For readers who want to check the relationship without doing the arithmetic manually, an A1C to blood sugar calculator can provide a quick estimate of average glucose from an A1C percentage. The result is best used for education and context rather than for diagnosis, medication changes, or other treatment decisions.
Why Your Meter Readings May Not Match Your Estimated Average
People sometimes calculate an eAG from their A1C and then wonder why their home glucose readings do not look exactly like that number. The reason is simple: the estimated average summarizes a long period, while a glucose meter captures a single point in time.
Someone with an eAG near 154 mg/dL may still see readings below 100 mg/dL at some times and readings well above 200 mg/dL at others. If those highs and lows occur often enough, the long-term average can still end up near 154 mg/dL.
Testing patterns also matter. A person who mainly checks fasting glucose may miss post-meal increases. Another person who tests primarily after meals may see readings that are higher than their overall average. Continuous glucose monitoring can reveal these patterns in more detail because it collects glucose information throughout the day and night.
Common A1C Ranges and What They Can Indicate
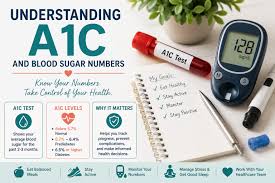
For diagnostic purposes in nonpregnant adults, an A1C below 5.7% is generally considered in the normal range. An A1C from 5.7% through 6.4% is in the prediabetes range, while an A1C of 6.5% or higher is in the diabetes range. Diagnosis should be made by a qualified healthcare professional, and abnormal results may need confirmation when obvious symptoms are not present.
These diagnostic ranges should not be confused with treatment targets for someone who already has diabetes. A commonly used A1C goal for many adults with diabetes is below 7%, but the appropriate target can be different depending on age, medications, risk of hypoglycemia, other medical conditions, pregnancy status, and individual circumstances.
This is why an A1C percentage is most useful when it is interpreted in context rather than judged as simply good or bad.
Why A1C Alone Cannot Show Glucose Variability
A major limitation of A1C is that it is an average. Averages can hide important differences in daily glucose patterns.
Two people can potentially have the same A1C while experiencing very different days. One person might spend most of the time near the average, while another could alternate between frequent high and low glucose levels. Their overall averages may be similar even though their risks and treatment needs are not.
A1C cannot directly show how often hypoglycemia occurs, how high glucose rises after meals, whether overnight glucose is stable, or how much time is spent within a target range. For people who use continuous glucose monitoring, metrics such as time in range and glucose variability can add important information that A1C does not provide.
What Can Cause A1C and Glucose Readings to Disagree?
Sometimes an A1C result appears higher or lower than expected based on home glucose readings. This does not automatically mean that either measurement is wrong. The difference may come from when glucose is being checked, how often it is being checked, or biological factors that influence the A1C test.
Conditions that affect red blood cells or hemoglobin can sometimes alter A1C results. Certain types of anemia, hemoglobin variants, recent blood loss or transfusion, and some kidney or liver conditions may affect the relationship between A1C and actual glucose exposure.
When A1C and meter or CGM data are consistently inconsistent, the discrepancy should be discussed with a healthcare professional. Depending on the situation, additional tests or different methods of assessing average glucose may be appropriate.
Using A1C and Daily Glucose Together
The most useful way to think about A1C and blood glucose is as two different views of the same overall picture. A1C is the wide-angle view; daily glucose data provide the close-up detail.
For example, an A1C may show that average glucose has improved over the previous few months. Meter or CGM data can then help explain how that improvement happened. Did fasting readings improve? Were post-meal spikes smaller? Was there more time spent in range? Did the improvement come with more episodes of low blood sugar?
These questions matter because a lower average is not automatically better if it comes at the cost of frequent or severe hypoglycemia. Safe glucose management focuses on the overall pattern, not only on pushing one number as low as possible.
Practical Ways to Make Glucose Data More Meaningful
Whether someone uses a traditional glucose meter, a continuous glucose monitor, or periodic laboratory testing, a few habits can make the information more useful when discussing results with a healthcare team.
- Look for trends rather than reacting to one isolated reading.
- Note the timing of glucose checks, such as fasting, before meals, or after meals.
- Keep track of medication changes, illness, unusual stress, sleep disruption, or major changes in activity.
- Compare A1C results over time instead of focusing only on a single test.
- Discuss repeated high or low readings with a healthcare professional rather than changing treatment independently.
- If A1C and daily glucose data do not seem to match, bring both sets of information to the next appointment.
The goal is not to collect the largest possible number of readings. It is to gather enough meaningful information to understand patterns and support informed healthcare decisions.
Frequently Asked Questions
Is A1C the same as average blood sugar?
A1C is a laboratory measure of glycated hemoglobin that reflects average glucose exposure over roughly the previous two to three months. Estimated average glucose, or eAG, is a calculated value that translates an A1C percentage into familiar glucose units such as mg/dL.
What average blood sugar corresponds to an A1C of 7%?
Using the widely used A1C-to-eAG relationship, an A1C of 7% corresponds to an estimated average glucose of about 154 mg/dL, or about 8.6 mmol/L. Actual glucose readings will still vary throughout the day.
Why can my fasting glucose look normal when my A1C is higher?
Fasting glucose represents only one part of the day. Post-meal glucose increases, overnight patterns, or periods that are not being tested can raise the overall average even when morning readings appear relatively lower.
Can one high blood sugar reading raise A1C?
A1C reflects glucose exposure over many weeks, so one isolated high reading is unlikely to determine the result. Repeated patterns of elevated glucose have a much greater effect.
Can A1C be used to adjust medication without seeing a doctor?
No. A1C and eAG conversions can help explain glucose data, but medication decisions should be made with a qualified healthcare professional who can consider the full clinical picture and the risk of low blood sugar.
The Bottom Line
A1C and blood sugar readings describe the same underlying issue – glucose exposure – but they do so from very different perspectives. A glucose reading shows what is happening at a specific moment, while A1C provides a longer-term view across several weeks. Converting A1C to estimated average glucose can make the relationship easier to understand, especially for people who are more familiar with meter readings than percentages.
The conversion should still be treated as an estimate. It cannot reveal every glucose spike, every low, or the amount of day-to-day variability. A1C is therefore most useful when it is interpreted alongside daily glucose data, symptoms, medications, medical history, and individualized treatment goals.
When the numbers seem inconsistent or when results fall outside an expected range, the safest next step is to discuss them with a qualified healthcare professional. Understanding the numbers is valuable, but appropriate interpretation depends on the full clinical context.
Medical Disclaimer: This article is for general educational purposes only and is not intended to diagnose, treat, or replace individualized medical advice. Readers should discuss personal glucose targets, test results, and treatment decisions with a qualified healthcare professional.